On February 5th, Dr. Spencer left this not on the WUWT website: S
[NOTE: While the tropospheric temperatures we compute come from the AMSU instrument that also flies on the NASA Aqua satellite, along with the AMSR-E, there is no connection between the calibrations of these two instruments.]
So this means the AMSRU used by UAH still uses the original hot load calibration.
UPDATE:
After making this post, I discovered that RSS data comes from a NOAA satellite, but the raw data isn't available online. See this post for more information.
I'm going to continue discussing both the AMSU and the AMSR-E because there is interesting data being collected by the AMSR-E.
============
In this post we're going to take a look at how the Aqua satellite measures temperatures for UAH and RSS. We're going to be looking at some of the problems that arise in doing this, so let me start off by saying this post isn't an attack on the work done by the scientists associated with the Aqua satellite. I think UAH and RSS provide the best estimate for temperatures. Never the less, there are problems with the methodology and we're going to discuss them.
Previous posts in this series are linked below:
Overview Of The Aqua Satellite
Looking At The Aqua Satellite Data
UAH Satellite Data
Dangit! More Climate Stuff. UAH and RSS Raw Data
Public information regarding the AMSU is provided by NASA. Public information regarding the AMSR-E is provided by NSIDC. Both sources, and additional sources, were used to create this article.
Calibration
Original Calibration Process
 Calibration is a process that makes instrument readings accurate and useful. Instruments are calibrated against known values so that there readings of unknown values can be considered reliable.
 NOTE: The calibration process described here differs from the calibration process described by Dr. Spencer. The calibration process described here has new steps that replace the process described by Dr. Spencer. The calibration process described by Dr. Spencer is presented here, and the new process is described after the original process. I believe the new process is the correct description. I've written to Dr. Spencer in order to get his input on this.
The temperature sensing instruments on the Aqua satellite must be calibrated. The original design of the calibration had the satellite reading the temperature of the Cosmic Background Radiation (CBR) to calibrate it against a known low temperature value of 2.7 K. A high temperature calibration was done against an onboard "Hot Load" whos temperature was measured by eight precision thermostats.
 With calibrated values for low and high temperatures available, values read from the Earth are simply scaled between these low and high values to determine the temperature.
However, after launch large thermal gradients due to solar heating developed within the hot load, making it difficult to determine from the thermostat readings the average effective temperature, or the temperature the radiometer sees. Because of this, a new method was needed to calibrate the satellite instruments.
New Calibration Process
 The new method takes a reading from Earth and compares it against readings from other satellites measuring the same location and time. From this additional information, the Earth temperature reading for the Aqua satellite is calibrated. Then based on the temperature of the CBR and the calibrated Earth temperate, the hot load temperature is extrapolated.
Because of this, the calibration of Aqua instruments is dependent upon the calibration of these other satellites. These satellites are the TMI and SSM/I satellites. The SSM/I satellite uses the CBR and hot load calibration method that Aqua originally intended to use. The TMI satellite uses statistical analysis and calibration information from the SSM/I satellite.
The end result of this process is the instruments on the Aqua satellite are calibrated without the need for ground-based temperature measurements.
Coverage
Coverage In Space
 The Aqua satellite provides coverage that is global between 89.24°N and 89.24°S. In a single day the satellite performs 28 half orbits around the Earth.
  There are several small diamond-shaped areas not covered by the scans, as well as small areas of the north and south pole that are not scanned. These missing area can be seen in the accompanying diagrams presented here.
Coverage In Time

The Aqua satellite takes about 50 minutes to cover a swath of the planet. Aqua observes a given location on Earth from zero to eight times per day, depending on latitude, longitude, and phase of Aqua's orbit. This figure shows the minimum, maximum, and average number of times that Aqua observes a location at a given latitude. The average is around one-degree latitude bands.
For example, at the equator on a given day, Aqua does not observe certain longitudes that fall between orbits on that day. At other longitudes, where subsequent orbits overlap, Aqua observes that point twice per day. On the average, Aqua observes each longitude at the equator slightly more than once per day.
Scanning Process
AMSR-E Scanning Process

The AMSR-E instrument has 6 channels, or "horns" it uses to collect data from the Earth. A physical description of the horns appears in the image above and their technical specifications, including which data products (Level 1B and/or Level 2A products) their readings appear in, are described in the table below.
Link to original table
| Reso-lution | Foot print | Mean spatial resolution | Channels | |||||
| 89.0 GHz | 36.5 GHz | 23.8 GHz | 18.7 GHz | 10.7 GHz | 6.9 GHz | |||
1 | 75 km x 43 km | 56 km | • | • | • | • | • | • o |
2 | 51 km x 29 km | 38 km | • | • | • | • | • o | |
3 | 27 km x 16 km | 21 km | • | • | • o | o | ||
4 | 14 km x 8 km | 12 km | • | o | ||||
5 | 6 km x 4 km | 5.4 km | o | |||||
• Includes Level-2A (smoothed) data
o Includes Level 1B (un smoothed) data at original spatial resolution
 At the 89 GHz scan resolution, the AMSR-E instrument was originally designed to collect data from the Earth using two "horns", called the A Horn and the B Horn. These horns provided coverage to different areas in a scan and together provided full information for the scan. A diagram of this process is presented here.
On November 11th, 2004 the 89 GHz A Horn of the AMSR-E instrument failed. It no longer provides data. To correct for this, the processing software was modified to use only the 89 GHz B Horn. The A Horn data still appears in the data files as zero value data.

An Along-scan error is caused by AMSR-E’s cold mirror or warm load entering the FOV of the feedhorns, or by the main reflector seeing part of the spacecraft. The RSS performed an analysis of the AMSR-E along-scan error and developed a correction.
In spite of RSS’s best efforts to accomplish a robust AMSR-E along-scan temperature correction, users should note that some contamination remains in the 14 pixels at the beginning of each scan line. Users should determine whether to include those pixels based on their specific research application and the effects of the contamination described below.
In early 2007, researchers at NSIDC conducted an along-scan error analysis by examining brightness temperature distributions for each sample position in three different, relatively uniform climatic regions over a sufficiently long time period to eliminate effects from random, transient events. The three regions included a portion of Antarctica, an area of the Indian Ocean south of Australia, and an area of African jungle in the Salonga National Park region of the Democratic Republic of the Congo.
NSIDC concluded that even after the RSS along-scan correction, a significant cold bias remains in brightness temperature measurements in all channels over Antarctic regions from the beginning of each scan line,. There is also some evidence of a cold bias in 7 GHz channels over jungle areas. There does not appear to be a bias in any channels observing ocean areas.
AMSU Scanning Process
Hardware for the two lowest frequencies is located in one module (AMSU-A2) and that for the remaining thirteen frequencies in the second module (AMSU-A1).
This arrangement puts the two lower atmospheric moisture viewing channels into one module and the oxygen absorption channels into a second common module to ensure commonality of viewing angle independent of any module and/or spacecraft misalignment due to structural or thermal distortions.
The table below shows which channels are responsible for measure different parts of the atmosphere. Click the link to the original table to see all the information.
Link to original table
| Cha- # | Cha Frequency (MHz) | Function |
|---|---|---|
| 1 | 23,800 | Water Vapor Burden |
| 2 | 31,400 | Surface Temperature |
| 3 | 50,300 | Surface Temperature |
| 4 | 52,800 | Surface Temperature |
| 5 | 53596115 | Tropospheric Temp |
| 6 | 54,400 | Tropospheric Temp |
| 7 | 54,940 | Tropospheric Temp |
| 8 | 55,500 | Tropospheric Temp |
| 9 | f0= 57,290.344 | Stratospheric Temp |
| 10 | f0217 | Stratospheric Temp |
| 11 | f0322.248 | Stratospheric Temp |
| 12 | f0322.222 | Stratospheric Temp |
| 13 | f0322.210 | Stratospheric Temp |
| 14 | f0322.24.5 | Stratospheric Temp |
| 15 | 89,000 | Cloud Top/Snow |
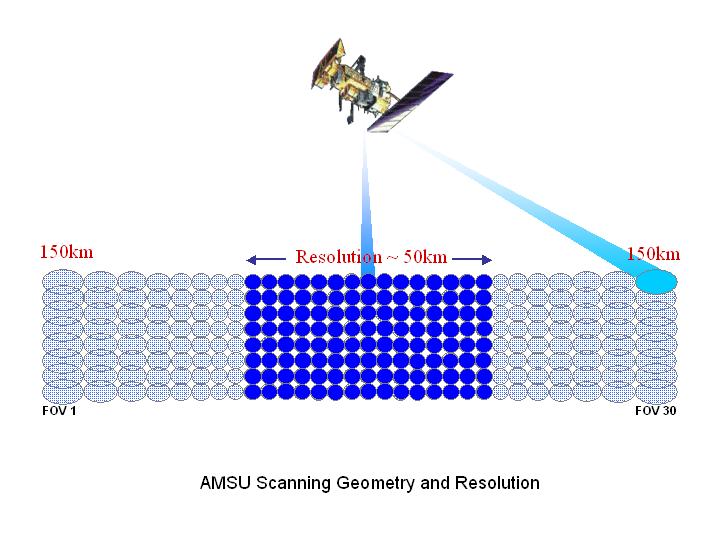
 The scanning resolution of the AMSU changes based on the angle of the scan to the instrument. Scans directly below the instrument have the best resolution and cover the smallest area. Scans at sharper angles to the instrument have poorer resolution and cover a wider area.
Each channel is multiplied by a weight constant, as shown in the diagram above.
Errors
 The UAH data obtained from the AMSU has a margin of error of +/- 0.5 degrees C. This is the margin of error for the absolute temperature, as opposed to the change in temperature over time (called the anomaly). If the error of the absolute temperature is constant, then the anomaly value is useful even though the change is smaller than the margin of error for the absolute temperature reading.
I assume the margin of error is believed to be constant. If it's actually say 0.3 in one reading than it's 0.3 in all readings. Otherwise the UAH anomaly data is useless, as the anomaly is significantly smaller than the margin of error.
The RSS data is estimated to have a margin of error between +/- 0.2 and 0.7 degrees C.
References:
Overview Of The Aqua Satellite
Looking At The Aqua Satellite Data
UAH Satellite Data
Dangit! More Climate Stuff. UAH and RSS Raw Data
How the UAH Global Temperatures Are Produced
AMSR-E/Aqua L2A Global Swath Spatially-Resampled Brightness Temperatures Documentation
AMSR-E Instrument Description
ON-ORBIT CALIBRATION OF AMSR-E AND THE RETRIEVAL OF OCEAN PRODUCTS
Special Sensor Microwave Imager (SSM/I)
Post-Launch Calibration of the TRMM Micro- wave Imager
Arctic temperature is still not above 0°C – the latest date in fifty years of record keeping
AMSR-E Observation Times
AMSR-E 89-GHz Scan Spacing
11 November 2004 Invalid Data from AMSR-E 89 GHz A-horn
Advanced Microwave Sounding Unit-A (AMSU-A) Instrument Guide
AMSU Weight Table
AMSU Scan Resolution
SOME CONVERGENCE OF GLOBAL WARMING ESTIMATES
Monthly UAH Data
RSS Analysis of MSU and AMSU Data


Temperature Calibrator
ReplyDeleteThere are tools that measure temperature. However, their work seem useless if these items are not properly calibrated using a temperature calibrator.